
The information provided herein is believed to be reliable at press time. Sirenza Microdevices assumes no responsibility for inaccuracies or ommisions.
Sirenza Microdevices assumes no responsibility for the use of this information, and all such information shall be entirely at the user's own risk. Prices and specifications are subject to change without
notice. No patent rights or licenses to any of the circuits described herein are implied or granted to any third party. Sirenza Microdevices does not authorize or warrant any Sirenza Microdevices product
for use in life-support devices and/or systems.
Copyright 2002 Sirenza Microdevices, Inc. All worldwide rights reserved.
522 Almanor Ave., Sunnyvale, CA 94085
Phone: (800) SMI-MMIC
http://www.sirenza.com
1
EDS102972 Rev A
Preliminary Data Sheet
The Sirenza SPM-2045 is a passive mixer designed for
systems that require high linearity down- or up-conversion.
It employs proprietary silicon FETs with proven reliable
core-and-wire baluns. It operates efficiently over a wide
range of Local Oscillator powers, with input third order
intercept remaining approximately 15-18 dB above LO
power over this range. This product is packaged in a stan-
dard surface mount module for excellent RF performance.
Product Specifications: Down-converter
Test Conditions: FLO = 1.8GHz FIF = 150MHz Frf = 1.95GHZ Plo = 17dBm
Parameters
Test Conditions
Unit
Min.
Typ.
Max.
RF Input Frequency Range
GHz
1.7
2.3
LO Frequency
GHz
1.7
2.3
IF Output Frequency
MHz
50
500
RF Return Loss
Frf = 1.9GHz
dB
14
LO Return Loss
Flo = 1.7GHz
dB
5
IF Return Loss
Fif=200MHz
dB
14
Conversion Loss
2 GHz
7.5
10
SSB Noise Figure
7.5
10
TOI (Input)
Plo=14dBm
dBm
28
Plo=17dBm
dBm
31
Plo=20dBm
dBm
33
P1dB (input)
Plo=17dBm
dBm
20
LO-RF isolation
2 GHz
dB
30
LO-IF isolation
2 GHz
dB
30
RF-IF isolation
2 GHz
dB
35
Functional Block Diagram
SPM-2045
High Linearity Passive FET Mixer
Product Features
Applications
�
Excellent linearity.
�
Efficient operation over wide LO power
range.
�
Well behaved over variations in frequency,
LO power, and port match.
�
PCS, DCS, UMTS upconverters and down-
converters
Product Description
RF
IF
LO

522 Almanor Ave., Sunnyvale, CA 94085
Phone: (800) SMI-MMIC
http://www.sirenza.com
2
EDS102972 Rev A
Preliminary Data Sheet
SPM-2045 High Linearity Mixer
Product Specifications: Up-converter
Test Conditions: FLO = 1.8GHz FIF = 150MHz Frf = 1.95GHZ Plo = 17dBm
Parameters
Test Conditions
Unit
Min.
Typ.
Max.
RF Output Frequency Range
GHz
1.7
2.3
LO Frequency
GHz
1.7
2.3
IF Input Frequency
MHz
40
300
RF Return Loss
Frf = 1.9GHz
dB
14
LO Return Loss
Flo = 1.7GHz
dB
5
IF Return Loss
Fif=200 MHz
dB
14
Conversion Loss
8
10
TOI (Input)
Plo=14dBm
dBm
23
Plo=17dBm
dBm
27
Plo=20dBm
dBm
30
P1dB (input)
Plo=17dBm
dBm
20
The SPM-2045 mixer is a MOSFET based high performance mixer designed for high linearity frequency conversion in the
2GHz band. This mixer features a wide latitude in LO power requirements. Conversion loss remains quite constant between
10dBm and 20dBm of LO power. Third Order Intercept is approximately proportional to the LO drive. This means that this
mixer can be used to replace a wide variety of mixers requiring a variety of LO powers.
The graphs on the following pages illustrate the performance of the SPM-2045 over a variety of operating conditions. In
order to duplicate these performance tests, the following precautions should be observed:
-The mixer should be presented with good return losses at all ports by using isolators or attenuators. This is especially true
of the LO port, because of the poor return loss of this port. If ripple is seen in a frequency sweep, it is likely due to reflections
caused by poor VSWR in a cable leading up to the device.
-The presence of harmonics in the LO can cause changes in TOI.
-Be aware that signals of many different frequencies exist at the output of the mixer, and any one can potentially cause the
spectrum analyzer to generate intermod.
-When measuring TOI, make sure the two generators supplying the RF signal are not interacting, causing intermod them-
selves.
Absolute Maximum Ratings
Parameters
Value
Unit
RF Input
+15
dBm
LO Input
+21
dBm
IF Input
+15
dBm
Operating Temperature
-40 to +85
�C
Storage Temperature
-65 to +150
�C
Operation of this device beyond any one of these limits may
cause permanent damage. For reliable continuous operation the
device voltage and current must not exceed the maximum oper-
ating values specified in the table on page one.
Caution: ESD Sensitive
Appropriate precaution in handling, packaging
and testing devices must be observed.

522 Almanor Ave., Sunnyvale, CA 94085
Phone: (800) SMI-MMIC
http://www.sirenza.com
3
EDS102972 Rev A
Preliminary Data Sheet
SPM-2045 High Linearity Mixer
Conversion Loss. vs Frequency, High Side LO,
Down-converter
7
8
9
10
11
1700
1800
1900
2000
2100
2200
RF Frequency
Conversion Loss
20dBm
17dBm
14dBm
Conversion Loss. Vs Frequency, Low Side LO
Down-converter
7
8
9
10
11
1700
1800
1900
2000
2100
2200
RF Frequency
Conversion Loss
20dBm
17dBm
14dBm
Conversion Loss vs. LO Power, Down-converter
RF=1900MHz, IF=150MHz
7
8
9
10
11
5
10
15
20
LO Power, dBm
Conversion Loss
High side lo
Low side lo
Conversion Loss vs. LO Power, Up-converter
RF=1900MHz, IF=150MHz
7
8
9
10
11
5
10
15
20
LO Power, dBm
Conversion Loss
High side lo
Low side lo
Conversion Loss. vs Frequency, High Side LO
Up-converter
7
8
9
10
11
1700
1800
1900
2000
2100
2200
RF Frequency
Conversion Loss
20dBm
17dBm
14dBm
Conversion Loss. vs Frequency, Low Side LO
Up-converter
7
8
9
10
11
1700
1800
1900
2000
2100
2200
RF Frequency
Conversion Loss
20dBm
17dBm
14dBm
These graphs show mixer conversion loss vs. frequency, with both low-side LO excitation (LO frequency below the RF fre-
quency) and high side excitation (LO frequency above the RF frequency). Operation both as a down-converter and an up-
converter is shown, with LO powers of 14, 17, and 20dBm. In all cases, the IF frequency is 150MHz.
522 Almanor Ave., Sunnyvale, CA 94085
Phone: (800) SMI-MMIC
http://www.sirenza.com
4
EDS102972 Rev A
Preliminary Data Sheet
SPM-2045 High Linearity Mixer
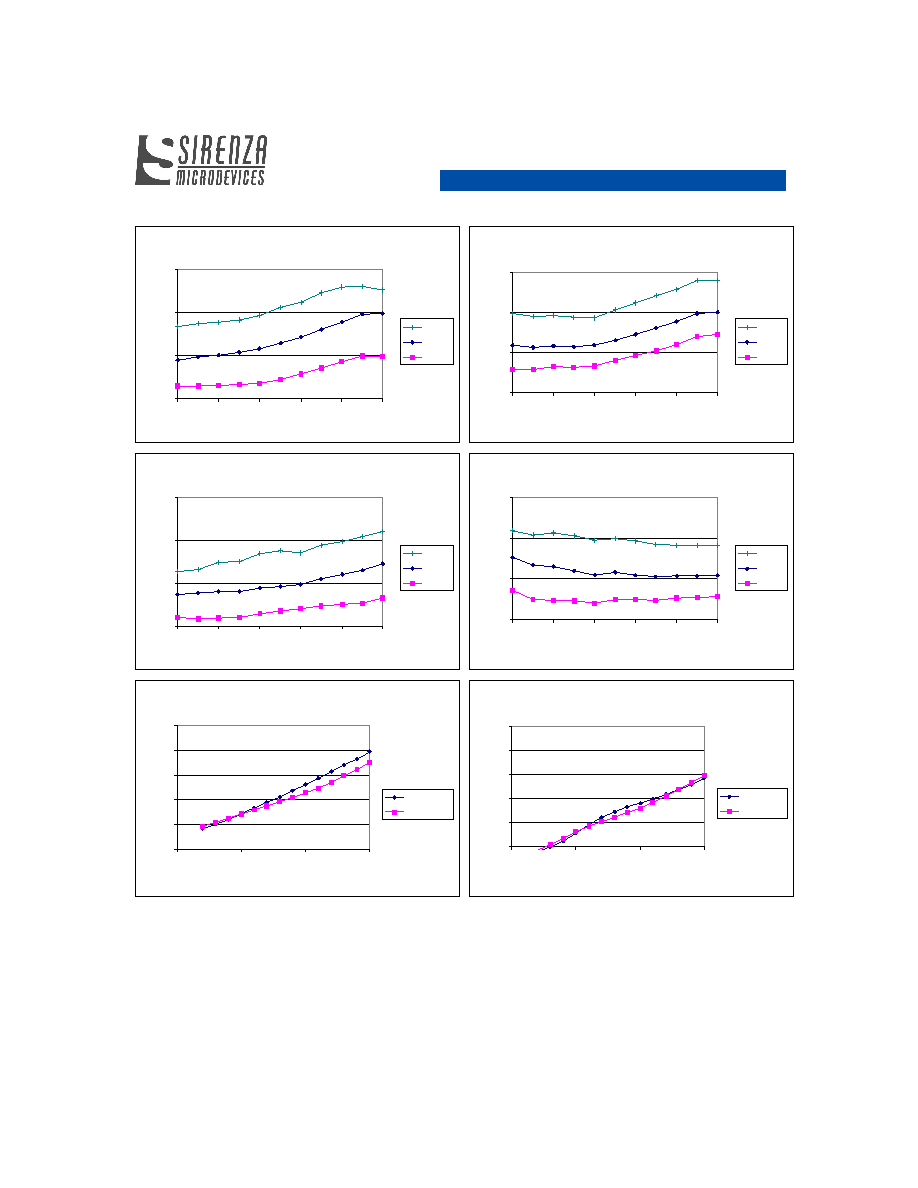
TOI vs. Frequency, High Side LO
Down-converter
25
30
35
40
1700
1800
1900
2000
2100
2200
RF Frequency
Input TOI, dBm
20dBm
17dBm
14dBm
TOI vs. Frequency, Low Side LO
Down-converter
25
30
35
40
1700
1800
1900
2000
2100
2200
RF Frequency
Input TOI, dBm
20dBm
17dBm
14dBm
TOI vs. Frequency, High Side LO
Up-converter
20
25
30
35
1700
1800
1900
2000
2100
2200
RF Frequency
Input TOI, dBm
20dBm
17dBm
14dBm
TOI vs. Frequency, Low Side LO
Up-converter
20
25
30
35
1700
1800
1900
2000
2100
2200
RF Freqyency
Input TOI, dBm
20dBm
17dBm
14dBm
TOI vs. LO Power, Down-converter
RF=1900MHz, IF=150MHz
15
20
25
30
35
40
5
10
15
20
LO Power, dBm
Input TOI, dBm
High side lo
Low side lo
TOI vs. LO Power, Up-converter
RF=1900MHz, IF=150MHz
15
20
25
30
35
40
5
10
15
20
LO Power, dBm
Input TOI, dBm
High side lo
Low side lo
These graphs show mixer Third Order Intercept (TOI) vs. frequency referenced to the input of the mixer (that is, referenced
to the RF port in the case off a down-converter, or the IF port in the case of an up-converter), with both low-side LO excita-
tion (LO frequency below the RF frequency) and high side excitation (LO frequency above the RF frequency). Operation
both as a down-converter and an up-converter is shown, with LO powers of 14, 17, and 20dBm. In all cases, the IF fre-
quency is 150MHz. The RF power used in measuring third order intercept is +4dBm. Note that third order products closely
follow the expected 3:1 slope.

522 Almanor Ave., Sunnyvale, CA 94085
Phone: (800) SMI-MMIC
http://www.sirenza.com
5
EDS102972 Rev A
Preliminary Data Sheet
SPM-2045 High Linearity Mixer
1500
1650
1800
1950
2100
2250
2400
1500
1600
1700
1800
1900
2000
2100
2200
2300
2400
RF Freq. MHz
LO
Freq.
MHz
Input Intercept, dBm
Down-converter
17dBm LO
34-36
32-34
30-32
28-30
26-28
1500
1650
1800
1950
2100
2250
2400
1500
1600
1700
1800
1900
2000
2100
2200
2300
2400
RF Freq. MHz
LO
Freq.
MHz
Conversion Loss, dB
Down-converter
17dBm LO
10.5-11
10-10.5
9.5-10
9-9.5
8.5-9
8-8.5
7.5-8
7-7.5
1500
1650
1800
1950
2100
2250
2400
1500
1600
1700
1800
1900
2000
2100
2200
2300
2400
RF Freq. MHz
LO
Freq.
MHz
Input Intercept, dBm
Up-converter
17dBm LO
30-32
28-30
26-28
24-26
22-24
1500
1650
1800
1950
2100
2250
2400
1500
1600
1700
1800
1900
2000
2100
2200
2300
2400
RF Freq. MHz
LO
Freq.
MHz
Conversion Loss, dB
Up-converter
17dBm LO
10.5-11
10-10.5
9.5-10
9-9.5
8.5-9
8-8.5
7.5-8
7-7.5
TOI vs. Temperature
RF=1950MHz, L0=1800MHz, 17dBm
30
30.5
31
31.5
32
-50
-30
-10
10
30
50
70
90
Temperature
Input TOI, dBm
Insertion Loss vs. Temperature
RF=1950MHz, L0=1800MHz, 17dBm
7
7.5
8
8.5
9
-50
-30
-10
10
30
50
70
90
Temperature
Insertion Loss
The contour graphs show mixer input TOI and conversion loss over a variety of RF and LO frequencies. These contour
graphs can be used to assess the suitability of these mixers over a variety of frequencies of operation. Note that constant
IF frequency curves can be overlaid as diagonal lines. Also shown are graphs of TOI and insertion loss vs. temperature.
These curves were measured down-converter mode.

522 Almanor Ave., Sunnyvale, CA 94085
Phone: (800) SMI-MMIC
http://www.sirenza.com
6
EDS102972 Rev A
Preliminary Data Sheet
SPM-2045 High Linearity Mixer
Isolation
LO Power = 17dBm
0
20
40
60
80
100
0
500
1000
1500
2000
2500
3000
Frequency
Isolation, dB
RF-IF
LO-RF
LO-IF
Half IF response
IF=200MHz, PLO=20dBm, PRF=10dBm
0
20
40
60
80
100
1500
1700
1900
2100
2300
2500
RF Frequency
Isolation, dB
low side
high side
Harmonics of LO at IF port
20dBm LO power, 2GHz.
-50
-40
-30
-20
-10
0
10
0
1000
2000
3000
LO Frequency Fundamental, MHz
Harmonic Level, dBm
2nd Harmonic
3rd Harmonic
Harmonics of LO to RF port
20dBm LO power, 2GHz
-50
-40
-30
-20
-10
0
0
1000
2000
3000
LO Frequency Fundamental, MHz
Harmonic Level, dBm
2nd Harmonic
3rd Harmonic
IF Port Return Loss
LO=2.0GHz, 17dBm
-20
-15
-10
-5
0
0
100
200
300
400
500
600
Frequency, MHz
Reflection Coefficient, dB
RF Port Return Loss
LO=2.0GHz, 17dBm
-20
-15
-10
-5
0
0
500
1000
1500
2000
2500
3000
3500
Frequency, MHz
Reflection Coefficient, dB
The isolation graph shows port isolation with a 2GHz LO at 17dB.
Half IF response is measured by applying RF signals (10dBm amplitude) 100MHz above or below the LO, and measuring
the level of the undesired IF component at 200MHz.

522 Almanor Ave., Sunnyvale, CA 94085
Phone: (800) SMI-MMIC
http://www.sirenza.com
7
EDS102972 Rev A
Preliminary Data Sheet
SPM-2045 High Linearity Mixer
C on versio n L oss C o m pression C u rves
R F=1.95GH z , LO=1.75GH z , D ow n -
con versio n
7
8
9
10
11
0
5
10
15
20
25
RF P ow e r, dBm
Conversion Loss
14dB m
17dB m
20dB m
C on version L oss C om p ression C urves
R F=1.95GH z , LO=1.75GH z , U p-co nversio n
7
8
9
10
11
0
5
10
15
20
25
RIF P ow e r, dBm
Conversion Loss
14dB m
17dB m
20dB m
LO Port Return Loss
LO=2.0GHz, 17dBm
-20
-15
-10
-5
0
0
500
1000
1500
2000
2500
3000
Frequency, MHz
Reflection Coefficient, dB
Package Dimensions
Part Number Ordering Information
Part Number
Reel Size
Devices/Reel
SPM-2045
13"
1000

522 Almanor Ave., Sunnyvale, CA 94085
Phone: (800) SMI-MMIC
http://www.sirenza.com
8
EDS102972 Rev A
Preliminary Data Sheet
SPM-2045 High Linearity Mixer
Input IP3, SPM 2045, LO Power = +17 dBm
With variations in IF port match
25
26
27
28
29
30
31
32
33
34
2 cm
4 cm
6 cm
8 cm
10 cm
12 cm
14 cm
16 cm
18 cm
20 cm
22 cm
24 cm
26 cm
28 cm
30 cm
Trombone extension length
IIP3 (dBm)
1750 MHz
1800 MHz
1850 MHz
Input IP3, +17 dBm LO Power, 150 MHz IF
With variation in RF port match
24
25
26
27
28
29
30
31
0
2
4
6
8
10
12
14
16
18
20
22
Tuner Length (cm)
IIP3 (dBm)
1750 MHz
1800 MHz
1850 MHz
Sensitivity to Port Match
These graphs demonstrate the sensitivity of the linearity of the SPM-2045 to the impedance of the source which drives the
RF port, and the load that the IF port sees. In this case, the mixer is operated as a down-converter with LO drive of 17dBm
and an IF frequency of 150MHz. Three LO frequencies are shown.
In the left graph, a variable-length 50 ohm transmission line ("trombone") is placed between the IF port of the mixer and a 2
dB, open-circuited attenuator to provide a 4dB return loss to the IF port. The length of the transmission line is changed to
vary the phase of the reflection coefficient, thus providing a variable impedance. This graph shows how the input TOI varies
with the phase of the reflection coefficient. Notice that significant degradation in TOI can occur with mismatch, depending on
the phase of the mismatch.
In the right graph, a double-stub tuner is placed between the RF source and the mixer in order to provide a non-50 ohm
impedance to the RF port. The stub separation was adjusted to provide a reflection coefficient of approximately -4 dB. The
tuner length was changed to vary the phase of the reflection coefficient, thus providing a variable impedance. This graph
shows how the input TOI varies with the phase of the reflection coefficient on the RF port. Note that the TOI is very tolerant of
variations in load impedance, showing a change of only 3dB.

522 Almanor Ave., Sunnyvale, CA 94085
Phone: (800) SMI-MMIC
http://www.sirenza.com
9
EDS102972 Rev A
Preliminary Data Sheet
SPM-2045 High Linearity Mixer
Sirenza
Microdevices
Mixer Eval Bd.
IF
J3
RF
J2
J1
LO
SPM Evaluation Board
Recommended connectors:
Johnson 142-0701-851 SMA end-launch connectors (or equivalent)
Demo Test Board Schematic