 | –≠–ª–µ–∫—Ç—Ä–æ–Ω–Ω—ã–π –∫–æ–º–ø–æ–Ω–µ–Ω—Ç: TA1204AF | –°–∫–∞—á–∞—Ç—å:  PDF PDF  ZIP ZIP |

TA1204AF
2001-02-07 1/25
TOSHIBA BIPOLAR LINEAR INTEGRATED CIRCUIT SILICON MONOLITHIC
TA1204AF
CORRECTION IC FOR LCD TV
TA1204AF is correction IC, that have common drive circuit, for
small or medium TFT panel (Normally White). TA1204AF is flat
44 pin package. TA1204AF have two linear RGB inputs.
FEATURES
Two linear RGB inputs
Selectable DC coupling or AC coupling (pedestal clamp) input
for both inputs
correction circuit with RGB fine adjustments
Drive gain control circuit with RGB fine adjustments
Cutoff level control circuit with RGB fine adjustments
Brightness and Contrast control circuits
AC and DC controls for the common electrode
Pre-drive output circuit with feedback input for common electrode
RGB output with Horizontal and / or Vertical reverse circuit
Weight: 1.15g (Typ.)
TENTATIVE
∑ TOSHIBA is continually working to improve the quality and reliability of its products. Nevertheless, semiconductor devices in general
can malfunction or fail due to their inherent electrical sensitivity and vulnerability to physical stress. It is the responsibility of the
buyer, when utilizing TOSHIBA products, to comply with the standards of safety in making a safe design for the entire system, and
to avoid situations in which a malfunction or failure of such TOSHIBA products could cause loss of human life, bodily injury or
damage to property.
In developing your designs, please ensure that TOSHIBA products are used within specified operating ranges as set forth in the
most recent TOSHIBA products specifications. Also, please keep in mind the precautions and conditions set forth in the "Handling
Guide for Semiconductor Devices," or "TOSHIBA Semiconductor Reliability Handbook" etc..
∑ The TOSHIBA products listed in this document are intended for usage in general electronics applications (computer, personal
equipment, office equipment, measuring equipment, industrial robotics, domestic appliances, etc.). These TOSHIBA products are
neither intended nor warranted for usage in equipment that requires extraordinarily high quality and/or reliability or a malfunction or
failure of which may cause loss of human life or bodily injury ("Unintended Usage"). Unintended Usage include atomic energy
control instruments, airplane or spaceship instruments, transportation instruments, traffic signal instruments, combustion control
instruments, medical instruments, all types of safety devices, etc.. Unintended Usage of TOSHIBA products listed in this document
shall be made at the customer's own risk.
∑ The products described in this document are subject to the foreign exchange and foreign trade laws.
∑ The information contained herein is presented only as a guide for the applications of our products. No responsibility is assumed by
TOSHIBA CORPORATION for any infringements of intellectual property or other rights of the third parties which may result from its
use. No license is granted by implication or otherwise under any intellectual property or other rights of TOSHIBA CORPORATION or
others.
∑ The information contained herein is subject to change without notice.
000707EBA1

TA1204AF
2001-02-07 2/25
BLOCK DIAGRAM

TA1204AF
2001-02-07 3/25
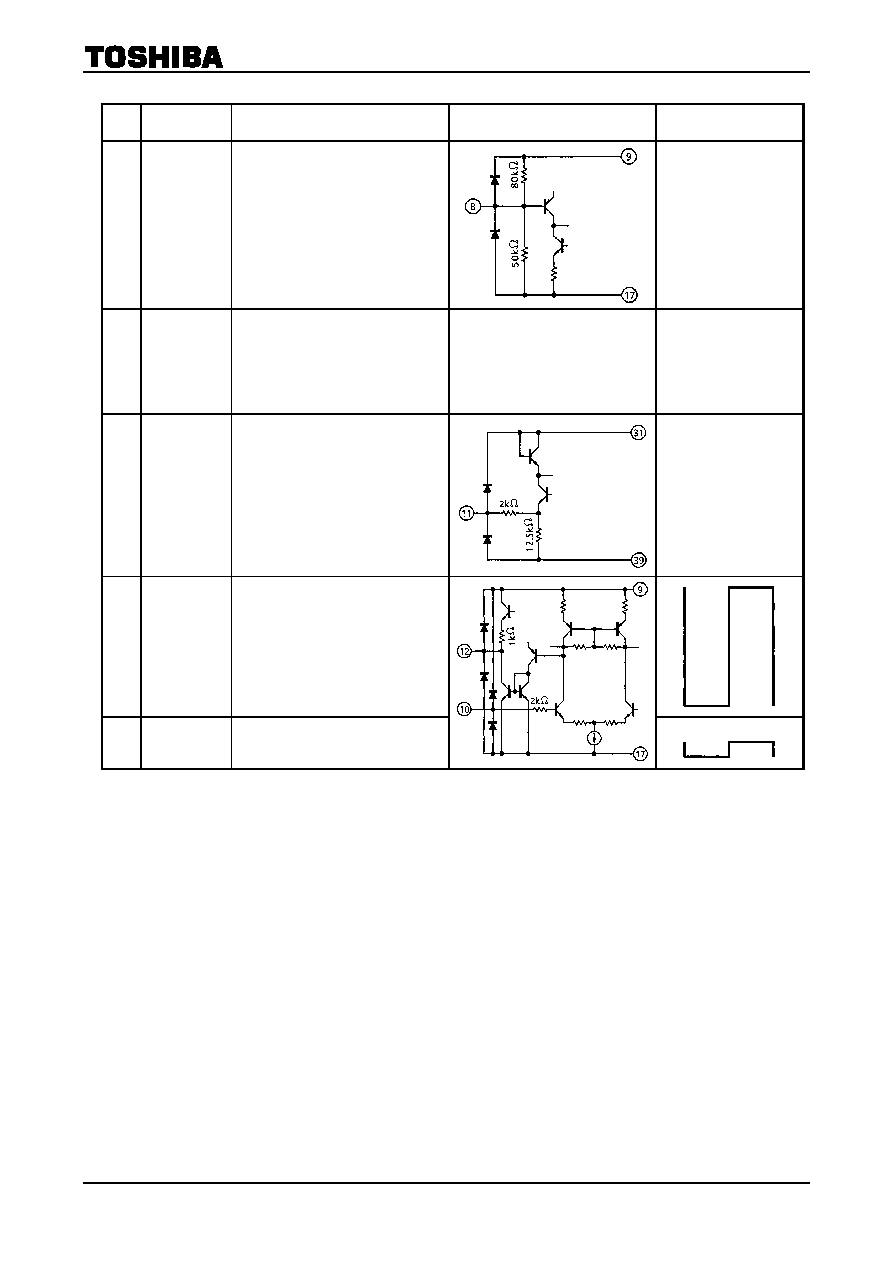
PIN FUNCTION
PIN
No.
PIN NAME
FUNCTION
INTERFACE CIRCUIT
INPUT / OUTPUT
SIGNAL
2 A
/
B
select
Switches input.
Do not leave open.
Do not switch duration from 2µs
before, to 4µs after clamp pulse A / B.
If pin 2 is not in use, fixed to V
CC
(5V)
or GND.
3
4
CP A IN
CP B IN
Inputs clamp pulse. Set clamp pulse
width to at least 2µs.
If pin 3 or 4 is not in use, fix to GND.
5 GND
GND pin for block to which power is
supplied from V
DD
pin.
Connect to 17 and 39 GND pins using
short thick line.
6 V
Inv.
Switches vertical polarity
inverted phase.
Switching between pins 6 and 7
switches RGB and VCOM
outputs.
Do not leave open.
If pin 6 is not in use, fixed to V
CC
(5V)
or GND.
7 Pol
In
Input polarity signal.
If pin 7 is not in use, fixed to V
CC
(5V)
or GND.
When pin 6 is High :
H : negative
polarity
output;
VCOM output is High.
L : positive polarity output; VCOM
output is Low.
When pin 6 is Low :
H :
positive polarity output; VCOM
output is High.
L : negative
polarity
output;
VCOM output is Low.
TA1204AF
2001-02-07 4/25
PIN
No.
PIN NAME
FUNCTION
INTERFACE CIRCUIT
INPUT / OUTPUT
SIGNAL
8 Comm
Cent
Adjusts common output center voltage.
When left open, biased 5V.
Voltage on this pin is used as common
output center voltage.
DC input
Adjustable voltage
range :
0.3 to 11V
9 V
DD
(+13V)
V
DD
pin
Connect 13V (typ.).
Depending on RGB output load or
adjustment conditions,
oscillation waveform may appear on
output pin. Thus, connect a bypass
capacitor near this pin.
11 Comm
AMP
Adjusts common output
amplitude.
When left open, biased 2.5V.
When voltage is adjusted to 2.5V,
amplitude of Comm FB is about 5Vp-p.
DC current input :
-0.2mA
(sink current) to
1.25mA
(source current)
VCOM amplitude :
0Vp-p to 8.8Vp-p
10 Comm
F.B.
Inputs common output feedback signal.
Connect common output buffer.
Maximum output current
: 250µA.
Control Comm Out pin
waveform so that common drive
waveform input to this pin has center
voltage and amplitude which are set by
Comm Cent and Comm AMP pins.
12 Comm
Out
Outputs drive signal for common
output buffer.
Connect common drive buffer.

TA1204AF
2001-02-07 5/25
PIN
No.
PIN NAME
FUNCTION
INTERFACE CIRCUIT
INPUT / OUTPUT
SIGNAL
13
16
20
R FBL
G FBL
B FBL
Connect filter for canceling positive
offset in relation to each axis.
DC
14
19
21
R Out
G Out
B Out
Outputs R / G / B signal.
Up to 300pF capacity can be
driven.
15
18
22
R FBH
G FBH
B FBH
Connect filter for canceling negative
offset in relation to each axis.
DC
17 GND
GND pin for block to which power is
supplied from V
DD
pin.
Connect to 5 and 39 GND pins using
short thick line.
23 V0
Cent.
Adjusts output signal center voltage.
When left open, biased 1 / 2V
DD
.
Voltage on this pin is used as common
output center voltage.
DC input
Adjustable voltage
range :
1 to 11.4V

TA1204AF
2001-02-07 6/25
PIN
No.
PIN NAME
FUNCTION
INTERFACE CIRCUIT
INPUT / OUTPUT
SIGNAL
24
26
R Cutoff
B Cutoff
Fine-adjusts cutoff voltage for R / B
axis.
When left open, biased 2.5V.
When voltage is adjusted to 2.5V,
cutoff fine voltage is 0V (typ.) in
relation to G axis.
DC input
0 to 5V
Cutoff voltage :
-2 to 2V
25 Com
Cutoff
Adjusts common cutoff voltage.
Batch-adjust three axes.
When left open, biased 2.5V.
When voltage is adjusted to 2.5V,
cutoff voltage is 5V (typ.).
DC input
0 to 5V
Cutoff voltage :
10 to 0V
27 Brightness
Adjusts brightness.
Batch adjusts three axes.
When left open, biased 3.3V.
When voltage is adjusted to 3.3V,
brightness voltage is 0V (typ.), center.
DC input
0 to 5V
Brightness voltage
: 3.8 to -2V
28
30
B Drive
R Drive
Fine-adjusts drive voltage for B / R
axis.
When left open, biased 2.5V.
When voltage is adjusted to 2.5V, drive
voltage adjustment is 0% (typ.).
DC input
0 to 5V
Output
amplitude :
45 to 150%

TA1204AF
2001-02-07 7/25
PIN
No.
PIN NAME
FUNCTION
INTERFACE CIRCUIT
INPUT / OUTPUT
SIGNAL
29 Com
Drive
Adjusts drive voltage.
Batch-adjusts three axes.
Do not leave open.
DC input
1.2 to 4.5V
Output
amplitude :
1.4 to 11V
p-p
31 V
CC
(+5V)
V
CC
pin
Connect 5V (typ.).
Connect bypass capacitor near this
pin.
32
34
36
B In (A)
G In (A)
R In (A)
Input R / G / B (A) signal.
In Clamp mode, input via clamp
capacitor.
100IRE = 0.7V
p-p
Clamp mode
DC mode
33 Contrast
Adjusts contrast.
Batch-adjusts three axes.
Do not leave open.
DC input
1.7 to 4.1V
Signal amplitude :
-30dB or below
to 7dB

TA1204AF
2001-02-07 8/25
PIN
No.
PIN NAME
FUNCTION
INTERFACE CIRCUIT
INPUT / OUTPUT
SIGNAL
35
B Clamp Fil.
Connect B-axis input pedestal offset
cancel filter.
Use G-axis pedestal as reference.
37 G
Clamp
Fil.
Connect G-axis input pedestal offset
cancel filter.
Use brightness adjustment voltage as
reference.
41 R
Clamp
Fil.
Connect R-axis input pedestal offset
cancel filter.
Use G-axis pedestal as reference.
DC
38
40
42
B In (B)
G In (B)
R In (B)
Input RGB (B) signal.
In Clamp mode, input via clamp
capacitor.
100IRE = 0.7V
p-p
Clamp mode
39 GND
GND pin for block to which power is
supplied from V
CC
pin.
Connect to 5 and 17 GND pins using
short thick line.
1
43
-R Cont
-B Cont
Fine-adjusts R / B-axis characteristic.
When left open, biased 3.7V.
When voltage is adjusted to 3.7V,
adjustment is typically 78% (at 60%
white input).
DC input
0 to 5V
adjustment :
66 to 78%
(at 60% white input)
44
-Com Cont
Adjusts common characteristic.
Batch-adjusts three axes.
When left open, biased 2.5V.
When voltage is adjusted to 2.5V,
adjustment is typically 72% (at 60%
white input).
DC input
0.9 to 4.9V
adjustment :
82 to 60%
(at white 60% input)

TA1204AF
2001-02-07 9/25
MAXIMUM RATINGS
(Ta = 25±3∞C)
CHARACTERISTIC SYMBOL
RATING
UNIT
Supply Voltage 1
V
DD
15
V
Supply Voltage 2
V
CC
8
V
Power Dissipation
P
Dmax.
960
(Note
1)
mW
Input Signal Voltage
E
in
GND-0.3~V
CC
+0.3
GND-0.3~V
DD
+0.3
V
Operating Temperature
T
opr
-20~65 ∞C
Storage Temperature
T
stg
-55~150 ∞C
Note 1 : See figure below.
Note 2 : Pin34, 36, 38, 40 and Pin42 are weak against static electricity and surge impulse.
Please take counter measure to meet, if necessary.
Figure Temperature decrease curve of power dissipation
RECOMMENDED SUPPLY VOLTAGE
PIN No.
PIN NAME
MIN
TYP.
MAX
UNIT
9 V
DD
12.5
13.0
13.5
V
31 V
CC
4.5
5.0
5.5
V

TA1204AF
2001-02-07 10/25
ELECTRICAL CHARACTERISTICS
(Unless otherwise specified, V
CC
= 5.0V, V
DD
= 13.0V, Ta = 25±3∞C)
DC CHARACTERISTICS
CHARACTERISTIC SYMBOL
TEST
CIR-
CUIT
TEST CONDITION
MIN
TYP.
MAX
UNIT
Supply Current 1
I
CC
17.6 22.0 29.3 mA
Supply Current 2
I
DD
13.6 17.0 22.7 mA
-R Cont.
V
1
3.5 3.7 3.9 V
Comm Cent.
V
8
4.8 5.0 5.2 V
Comm F.B.
V
10
4.6 5.0 5.4 V
Comm AMP
V
11
2.3 2.5 2.7 V
Comm Out
V
12
4.65 5.05 5.45 V
R FBL
V
13
2.65 3.05 3.45 V
R Out
V
14
6.2 6.5 6.8 V
R FBH
V
15
2.6 3.0 3.4 V
G FBL
V
16
2.65 3.05 3.45 V
G FBH
V
18
2.6 3.0 3.4 V
G Out
V
19
6.2 6.5 6.8 V
B FBL
V
20
2.65 3.05 3.45 V
B Out
V
21
6.2 6.5 6.8 V
B FBH
V
22
2.6 3.0 3.4 V
V
0
Cent
V
23
6.3 6.5 6.7 V
R Cutoff
V
24
2.3 2.5 2.7 V
Com Cutoff
V
25
2.3 2.5 2.7 V
B Cutoff
V
26
2.3 2.5 2.7 V
Brightness V
27
3.1 3.3 3.5 V
B Drive
V
28
2.3 2.5 2.7 V
R Drive
V
30
2.3 2.5 2.7 V
B In1
V
32
0.7 0.9 1.1 V
G In1
V
34
0.7 0.9 1.1 V
B Clamp Fil.
V
35
2.2 2.8 3.4 V
R In1
V
36
0.7 0.9 1.1 V
G Clamp Fil.
V
37
2.2 2.8 3.4 V
B In2
V
38
0.7 0.9 1.1 V
G In2
V
40
0.7 0.9 1.1 V
R Clamp Fil.
V
41
2.2 2.8 3.4 V
R In2
V
42
0.7 0.9 1.1 V
-B Cont.
V
43
3.5 3.7 3.9 V
-Com Cont.
V
44
2.3 2.5 2.7 V

TA1204AF
2001-02-07 11/25
AC CHARACTERISTICS
CHARACTERISTIC SYMBOL
TEST
CIR-
CUIT
TEST CONDITION
MIN
TYP.
MAX
UNIT
RGB Input Dynamic Range
A
in
(Note
1)
1.5 1.8 2.1 V
Cross Talk Between Channels
X
ch
(Note
2)
-60
-46 dB
Crosstalk Over Switching Circuit
X
sw
(Note
3)
-60
-50 dB
Typical S
out
2.9 3.3 3.7 V
0-p
Deviation
S
o
250 mV
Output Signal
Amplitude
Polarity Gap
S
op
(Note 4)
100 mV
Max. Gain
A
CM
5.6 6.7 7.6 dB
Contrast Adj.
Deviation
A
CM
(Note 5)
0.5 dB
Typical B
rs
-0.33 -0.17 -0.01 V
Deviation
B
rs
(Note 6)
100 mV
Max. Gain
B
rM
3.2 3.8 4.4 V
Max. Deviation
B
rM
(Note 7)
200 mV
Min. Gain
B
rL
-2.6
-2.1
-1.5 V
Brightness
Adj.
Min. Deviation
B
rL
(Note 8)
200 mV
Typical Level
C
oS
4.6 5 5.4 V
Typical Deviation
C
oS
(Note 9)
100 mV
Max. Range
C
oM
9.3
9.8
10.3
V
Max. Deviation
C
oM
(Note 10)
100 mV
Min. Range
C
oL
0
0.07
0.5
V
Cut-off
Min. Deviation
C
oL
(Note 11)
100 mV
Max. C
VM
1.7
1.95
2.1
Min. C
vL
-2.1
-1.95
-1.8
V
Cut-off Fine
Adjustment
Range
Deviation
C
vp
(Note 12)
250 mV
Max. C
oM
10.6
11.15
11.7
V
Max. Deviation
C
oM
(Note 13)
150 mV
Min D
oL
0.95 1.35 1.75 V
Drive Output
Amplitude
Min. Deviation
D
oL
(Note 14)
150 mV
Max. C
vM
145 151.5 157
Min. C
vL
39 45.5 52
Drive Fine
Adjustment
Deviation
C
vp
(Note 15)
5
%

TA1204AF
2001-02-07 12/25
CHARACTERISTIC SYMBOL
TEST
CIR-
CUIT
TEST CONDITION
MIN
TYP.
MAX
UNIT
Output Frequency Response
f
out
8
12
Output Frequency Response
Deviation
f
out
(Note 16)
0.5
MHz
Output Dynamic Range
A
out
(Note
17)
10.6
11.15
11.7
V
p-p
Output Through Rate
SR
s
(Note
18)
50
65
V
/µs
Output S / N
SN
(Note
19)
50
dB
Typical V
oS
6.18
6.48
6.78
V
Polarity Reverse
Center Voltage
Deviation
V
oS
(Note 20)
100 mV
Max. Variable
Range
V
oM
11.08
11.38
11.58
Min. Variable
Range
V
oL
0.74
0.94
1.14
V
Polarity Reverse
Center Voltage
Deviation
V
oML
(Note 21)
100 mV
Typical G
s
67
72
77
%
Deviation
G
s
5 %
Characteristic
Polarity Gap
G
sp
(Note 22)
3 %
Max. G
SM
75
81.5
85
Min. G
SL
57
60
63
%
Characteristic
Variable Range
Deviation
G
SML
(Note 23)
53 %
Max. G
VM
73
78
83
Min. G
VL
61
66
71
%
Fine
Adjustment
Characteristic
Variable Range
Deviation
G
VML
(Note 24)
5 %
Common Drive Output Typical
Amplitude
S
cS
(Note
25)
4.6
5.1
5.6
V
p-p
Max. S
cM
8.1
8.8
8.9
Common Drive
Output Amplitude
Variable Range
Min. S
cL
(Note 26)
0 0.5
V
Typical Common Drive Center
Voltage
V
cS
(Note
27)
4.7
5
5.2
V
Max. V
cM
10.7
11
11.3
Common Drive
Center Voltage
Variable Range
Min. V
cL
(Note 28)
0.1 0.27 0.5
V
Common Drive Output Through Rate
SR
c
(Note
29)
5
9
V
/µs
Clamp Signal Input Threshold 1
V
CP1
(Note
30)
1.2
1.4
1.6
V
Clamp Signal Input Threshold 2
V
CP2
(Note
31)
3.3
3.5
3.7
V
Input-Switching Signal Threshold
V
SEL
(Note
32)
2.3
2.5
2.7
V
Polarity Reverse Signal Threshold
V
POL
(Note
33)
2.4
2.6
2.8
V
Polarity Reverse Phase-Switching
Signal Threshold
V
INV
(Note
34)
2.6
2.8
3
V

TA1204AF
2001-02-07 13/25
METHOD OF MEASUREMENT
Note 1:
Image signal input dynamic range
∑ Test condition 2 (direct-coupling mode)
∑ Input :
G In1 / G In2
Test signal 1
For input A, measure the peak levels at input pins 32 {34, 36} immediately before the top / down
clipping of the output signals of output pins 21 {19, 14}, while adjusting VR34 and changing the
pedestal levels at the end of the input pin. Specify the difference between the upper and lower
measurement values as the dynamic range to be obtained.
For input B, change SW
2B
from a to b, adjust VR40, and take the same measurements for input pins
38 {40, 42}.
Note 2:
Inter-channel crosstalk 1
∑ Test condition 5 (CP mode, fixed polarity)
∑ Input :
X In1 / X In2
Test No. 2
Measurement frequency 1MHz
∑ Other input pins
(Y In1 ∑ Z In1 / Y In2 ∑ Z In2) : short to GND
Change SW
27
from a to b as before, and adjust VR27 so there is no difference between the 0 and
black levels in the output waveform at pin 19.
For input A, input it to the X-axis (pin X In1) and measure the amplitude values of the 1MHz
components at output pins 21, 19, and 14. Short to GND the other input pins (Y In1 / Z In1).
Crosstalk from the X-axis to the Y-axis = (amplitude value of the Y-axis output) /
(amplitude value of the X-axis output)
Crosstalk from the X-axis to the Z-axis = (amplitude value of the Z-axis output) /
(amplitude value of the X-axis output)
Change the combination of X, Y, and Z among B (output pin 21), G (output pin 19), and R (output pin
14), and repeat the same measurement. For the B input, change SW
2B
from a to b, set the input pin
at BINX, short to GND the other input pins (Y In2 / Z In2), and measure as for input A.
Note 3:
Switched SW crosstalk
∑ Test condition 5 (CP mode, fixed polarity)
∑ Input :
X In1 (X In2 = short to GND)
/ X In2 (X In1 = short to GND)
Test signal 2
Measurement frequency 1MHz
Change SW
27
from a to b as before, adjust VR27 so there is no difference between the 0 level and
the black level in the output waveform of pin 19, input it to the channel A X-axis (pin X In1), switch
SW
2B
from a to b, and measure the amplitude value of the 1MHz component of the X-axis output
pins (pin 21 when X = B, pin 19 when X = G, and pin 14 when X = R) before and after switching.
Crosstalk from input A to input B =
(amplitude value when SW = b) /
(amplitude value when SW = a)
Change the input pin to channel B (pin X In2) and repeat the same measurement.
Crosstalk from input B to input A =
(amplitude value when SW = a) /
(amplitude value when SW = b)
Repeat this measurement replacing B, G, and R as the X-axis.
Note 4:
Typical amplitude for signal outputs, inter-axis amplitude deviation, and polarity difference
∑ Test condition 4 (CP mode)
∑ Input :
X In1
Test signal 3
Input signals (0.7V
p-p
) including black and white levels at input A (X In1).
Measure the amplitudes between the black and white waveform levels at output pins (pin 21 when X
= B, pin 19 when X = G, and pin 14 when X = R) for positive and negative polarities.
Repeat this measurement replacing B, G, and R as the X-axis.

TA1204AF
2001-02-07 14/25
Note 5:
Maximum amount of contrast adjustment, inter-axis deviation
∑ Test condition 4 (CP mode)
∑ Input :
X In1
Test signal 3
∑ VR33 : Max (pin 335V)
Change SW
33
from a to b, and adjust VR33 until 5V is applied to pin 33. Input a signal (0.7V
p-p
)
including black and white levels at input A. Measure the amplitudes between the black and white
waveform levels at output terminals (pin 21 when X = B, pin 19 when X = G, and pin 14 when X = R).
Calculate their ratio with the typical signal output amplitude and express it in dB units. Repeat this
measurement replacing B, G, and R as the X-axis.
Note 6:
Typical amount of brightness adjustment, inter-axis deviation
∑ Test condition 4 (CP mode)
∑ Input :
X In1
Test signal 3
Input a signal (0.7V
p-p
) including black and white levels to input A.
Measure the voltage difference between the black and 0 waveform levels for an output pin (pin 21
when X = G, pin 19 when X = G, and pin 14 when X = R) for positive and negative polarities.
Repeat this measurement replacing B, G, and R as the X-axis.
Note 7:
Maximum amount of brightness adjustment, inter-axis difference
∑ Test condition 4 (CP mode)
∑ Input :
X In1
Test No. 3
∑ VR27 : Max (pin 270V)
Change SW
27
from OFF to ON, and adjust VR27 until 0V is applied to pin 27.
Input a signal (0.7V
p-p
) including black and white levels in input A (X In1).
Measure the voltage difference between the black and 0 waveform levels for an output pin (pin 21
when X = B, pin 19 when X = G, and pin 14 when X = R).
Repeat this measurement replacing B, G, and R as the X-axis.
Note 8:
Minimum amount of brightness adjustment
∑ Test condition 4 (CP mode)
∑ Input :
X In1
Test signal 3
Change SW
27
from OFF to ON, and adjust VR27 until 5V is applied to pin 27. Input a signal
(0.7V
p-p
) including black and white levels to input A (X In1).
Measure the voltage difference between black and 0 waveform levels for an output pin (pin 21 when
X = B, pin 19 when X = G, and pin 14 when X = R).
Repeat this measurement replacing B, G, and R as the X-axis.
Note 9:
Typical cut-off level, inter-axis deviation
∑ Test condition 4 (CP mode)
∑ Input :
X In1
Test signal 3
Input a signal (0.7V
p-p
) including black and white levels to input A (X In1).
Measure the voltage difference between the 0 levels of the positive and negative polarity outputs in
an output pin (pin 21 when X = B, pin 19 when X = G, and pin 14 when X = R).
Repeat this measurement replacing B, G, and R as the X-axis.
Note 10:
Maximum range of cut-off adjustment, inter-axis deviation
∑ Test condition 4 (CP mode)
∑ Input :
X In1
Test signal 3
∑ VR25 : Max (pin 250V)
Change SW
25
from OFF to ON, and adjust VR25 fully until 0V is applied to pin 25.
Input a signal (0.7V
p-p
) including black and white levels to input A (X In1).
Measure the voltage difference between the 0 level of the positive output and that of the negative
output in an output pin (pin 21 when X = B, pin 19 when X = G, and pin 14 when X = R).
Repeat this measurement replacing B, G, and R as the X-axis.

TA1204AF
2001-02-07 15/25
Note 11:
Minimum range of cut-off adjustment, inter-axis deviation
∑ Test condition 4 (CP mode)
∑ Input :
X In1
Test signal 3
∑ VR25 : Min (pin 255V)
Change SW
25
from OFF to ON, and adjust VR25 fully until 5V can be applied to pin 25.
Input a signal (0.7V
p-p
) including black and white levels to input A (X In1).
Measure the voltage difference between the 0 level of the positive output and that of the negative
output in an output pin (pin 21 when X = B, pin 19 when X = G, and pin 14 when X = R).
Repeat this measurement replacing B, G, and R as the X-axis.
Note 12:
Maximum cut-off fine adjustment range value, inter-axis deviation
∑ Test condition 4 (CP mode)
∑ Input :
X In1 (X = B or R)
Test signal 3
X = B : VR26 : Min / Max (pin 260V / 5V)
X = R : VR24 : Min / Max (pin 240V / 5V)
When measuring channel B (X = B), change SW
26
from OFF to ON, and input a signal (0.7V
p-p
)
including black and white levels in input A (B In1). Turn VR26 clockwise and anticlockwise and
measure the maximum value (when pin 26 = 5V and pin 26 = 0V) of the voltage difference from the
0 levels of the positive and negative polarity outputs of an output pin (pin 21). Obtain the voltage
difference from the No. 15 standard cut-off level of each voltage.
For channel R (X = R), change SW
24
from OFF to ON, turn VR24 clockwise and anticlockwise, and
make the same measurement as for channel B with output pin (14) using R In1 as the input pin.
Note 13:
Maximum value of drive output amplitude adjustment, inter-axis deviation
∑ Test condition 4 (CP mode)
∑ Input :
X In1
Test signal 3
∑ VR29 : Max
Change SW
25
from a to b, and adjust VR25 until 0V is applied to pin 25. Input a signal (0.7V
p-p
)
including black and white levels in input A (X In1). Change SW29 from a to b, raise the voltage
applied to pin
29
by adjusting VR29, and measure the amplitude value when the waveform
amplitude stops increasing from the black to the white level for an output pin (pin 21 when X = B,
pin 19 when X = G, and pin 14 when X = R) for positive and negative polarity outputs.
Note 14:
Minimum value of drive output amplitude adjustment, inter-axis deviation
∑ Test condition 4 (CP mode)
∑ Input :
X In1
Test signal 3
∑ VR29 : Min
Input a signal (0.7V
p-p
) including black and white levels in input A (X In1).
Change SW
29
from a to b, lower the voltage applied to pin 29 by adjusting VR29, and measure the
amplitude value when the waveform amplitude stops decreasing from the black to the white level at
an output pin (pin 21 when X = B, pin 19 when X = G, and pin 14 when X = R) in positive and
negative polarity outputs.
Note 15:
Maximum and minimum drive fine adjustment values, inter-axis deviation
∑ Test condition 4 (CP mode)
∑ Input :
X In1 (X = B or R)
Test signal 3
X = B : VR28 : Min / Max (pin 280V / 5V)
X = R : VR30 : Min / Max (pin 300V / 5V)
When measuring channel B, change SW
28
from OFF to ON, and input a signal (0.7V
p-p
) including
white and black levels in input A (B In1).
Turn VR28 clockwise and anticlockwise and measure the maximum value (when pin 28 = 5V) and
the minimum value (on condition of pin 28 = 0V) of the voltage difference between the black and the
white level of an output pin (pin 21). Obtain the ratio between the black and white levels of the
output pin (pin 19) of each voltage.
When measuring channel P (X = R), change SW
30
from OFF to ON, and take the same measurement
as for the channel B for an output pin (pin 14) by turning VR30 clockwise and anticlockwise, with R
In1 as the input pin.

TA1204AF
2001-02-07 16/25
Note 16:
Signal frequency characteristics, inter-axis deviation
∑ Test condition 5 (CP mode, fixed polarity)
∑ Input :
X In1
Test signal 2 (sweep)
Input test signal 2 to X In1, raise its frequency from 500kHz to 20MHz, and observe the amplitudes
of the frequency components. Measure the frequency for a 3dB fall in output amplitude. Take the
same measurements as for positive polarity by changing SW
7B
from a to b.
Note 17: Output dynamic range
∑ Test condition 4 (CP mode)
∑ Input :
X In1
Test signal 3
∑ VR23 : Max / Min
Input a signal (0.7V
p-p
) including black and white levels to input A (X In1). Change SW
23
from a to b,
raise and lower the voltage applied to pin 23 by turning VR23 clockwise and anticlockwise, measure
the maximum and minimum black waveform levels for an output pin (pin 21 when X = B, pin 19
when X = G, and pin 14 when X = R), and thus obtain the voltage difference.
Note 18:
Signal output through-rate
∑ Test condition 4 (CP mode)
∑ Input :
X In1
Test signal 5
Input to input A (X In1) a test signal whose 10 to 90% rise / fall times are less than 50ns in a
rectangular waveform that repeats black and white levels. Measure the 10 to 90% rise / fall times in
the waveform of the output pin (pin 21 when X = B, pin 19 when X = G, and pin 14 when X = R), and
convert this to a through-rate.
Note 19:
Signal output S / N
∑ Test condition 5 (CP mode, fixed polarity)
∑ Input : no signal
Noise measurement band DC to 6MHz
Change SW
27
from a to b, and adjust VR27 while looking at the waveform of an output pin (pin 21,
pin 19, pin 14) so that the difference between the 0 and black levels becomes 0. Measure the noise
voltage (measurement band: ~6MHz) of the output pins in this state. Repeat this measurement for
each output pin. Calculate the ratio of the No. 9 typical output amplitude to the measured noise
voltage, and express it in dB units.
For a positive polarity measurement, repeat the above measurement by changing SW
7B
from a to b.
Note 20:
Reversed polarity center voltage, typical value, inter-axis deviation
∑ Test condition 4 (CP mode)
∑ Input : no signal
Measure the 0 levels of the positive and negative polarities of the output waveform at an output pin
(pin 21 when X = B, pin 19 when X = G, and pin 14 when X = R), and measure the mean value of the
two levels.
Repeat this measurement replacing B, G, and R as the X-axis.
Note 21:
Reversed polarity center voltage, maximum and minimum variable ranges, inter-axis deviation
∑ Test condition 4 (CP mode)
∑ Input : no signal
∑ VR23 : Max / Min
Change SW
25
from a to b, adjust VR26 and set the voltage applied to pin 25 at 5V, thereby
minimizing the cut-off. Change SW
23
from a to b, raise and lower the voltage applied to pin 23 by
turning VR23 clockwise and anticlockwise. Obtain the center voltage of the positive and negative 0
levels when the waveform of an output pin (pin 21 when X = B, pin 19 when X = G and pin 14 when
X = R) approaches V
DD
and stops rising, and set this as the maximum value. Obtain the center
voltage of positive and negative 0 levels when the waveform of the output pin approaches GND and
these levels stop decreasing, and make this voltage the minimum value.
Repeat this measurement replacing B, G, and R as the X-axis.

TA1204AF
2001-02-07 17/25
Note 22:
Typical characteristics, inter-axis deviation, polarity difference
∑ Test condition 4 (CP mode)
∑ Input :
X In1
Test signal 3
Input test signal 3 including black, white, and 60% levels to input A (X In1). Measure the voltage
difference (set at 1) between the white and black levels and the voltage difference (set at 2) between
the 60% input and black levels in the waveform of an output pin (pin 21 when X = B, pin 19 when X
= G, and pin 14 when X = R). Obtain a voltage difference ratio of 2:1. Repeat for the positive and
negative polarity outputs.
Repeat this measurement replacing B, G, and R as the X-axis.
Note 23:
characteristic variable range, maximum and minimum-characteristic variable range, inter-axis deviation
∑ Test condition 4 (CP mode)
∑ Input :
X In1
Test signal 3
∑ VR44 : Max / Min (pin 440V / 5V)
Input test signal 3 including black, white, and 60% levels to input A (X In1). Change SW
44
from a to
b, adjust VR44 and set the voltage applied to pin 44 at 0V, thereby maximizing the control.
Measure the voltage difference (set to 1) between the white and black waveform levels for an output
pin (pin 21 when X = B, pin 19 when X = G, and pin 14 when X = R) and the voltage difference (set
at 2) between the 60% input and black levels. Obtain a voltage difference ratio of 2:1 and set this as
the maximum value for the characteristics. Next, adjust VR44 in the opposite direction, set the
voltage applied to pin 44 to 5V, and thus minimize the control. Obtain a voltage difference ratio of
2:1 as for the measurement of the maximum value, and set this as the minimum value of the
characteristics.
Repeat this measurement replacing B, G, and R as the X-axis.
Note 24:
fine adjustment characteristic variable range, maximum and minimum fine adjustment characteristic
variable ranges, inter-axis deviation
∑ Test condition 4 (CP mode)
∑ Input :
X In1 (X = B or R)
Test signal 3
X = B : VR43
: Max / Min (pin 435V / 2.5V)
X = R : VR1
: Max / Min (pin 15V / 2.5V)
When measuring channel B, change SW
43
from OFF to ON, and input test signal 3 including black,
white, and 60% levels to input A (B In1). Turn VR43 fully, set the voltage applied to pin 43 at 5V, and
thus maximize the control.
Measure the voltage difference (fixed at 1) between white and black waveform levels for output pin
21 and the voltage difference (fixed at 2) of 60% input and black levels. Obtain a voltage difference
ratio of 2:1 and set this as the maximum value of the characteristics. Next, set the voltage applied
to pin 43 to 2.5V by turning VR43 fully in the opposite direction, thereby minimizing the
characteristics. Obtain a voltage difference ratio of 2:1 and thereby minimize the value of the
characteristics in the same way the maximum value was measured. When measuring channel R (X =
R) change SW
1
from OFF to ON, turn VR1 clockwise and anticlockwise with R In1 as the input pin,
and thus measure output pin 14 in the same way as channel B.
Note 25:
Typical amplitude of common electrode signals
∑ Test condition 4
∑ Input : no signal
Measure the voltage difference between H and L levels in the output waveform of pin 10.
Note 26: Amplitude of common electrode signals, maximum variable range, amplitude of common electrode
signals, minimum variable range
∑ Test condition 4
∑ Input : no signal
Measure the voltage difference between H and L waveform levels for pin 10 output when terminal 11
is shorted to GND, and thus set this as the maximum amplitude.
Measure the voltage difference between the H and L levels for the output waveform of pin 10 when
pin 11 is shorted with V
CC
(%V), and set this as the minimum amplitude.

TA1204AF
2001-02-07 18/25
Note 27:
Typical common electrode signal center voltage
∑ Test condition 4
∑ Input : no signal
Obtain the mean value of H and L levels in the output waveform at pin 10 and set this as the center
voltage.
Note 28:
Maximum and minimum common electrode signal center voltage variable ranges
∑ Test condition 4
∑ Input : no signal
∑ VR8 : Max / Min
Keep pin 11 shorted with V
CC
(5V). Change SW
8
from OFF to ON, turn VR8 clockwise and
anticlockwise and thus obtain the upper limit (maximum center voltage) and the lower limit
(minimum center voltage) in a potential change at pin 10.
Note 29:
Common electrode signal output through-rate
∑ Test condition 4
∑ Input : no signal
Measure the 10 to 90% rise and fall times in the change between the H and L levels for the output
waveform of pin 10, and convert these into through-rates.
Note 30:
Clamp signal output, threshold 1
∑ Test condition 6
Adjust VR34 and VR40 so that the voltage at pins 34 and 40 becomes 0.9V. Gradually raise from 0V
the direct current voltage applied to CP A In (pin 3), and measure the voltage at CP A In when the
normal voltage of 9.0±0.4V is output from G output pin (pin 19). Change SW
2M
from a to b, and
make similar measurements for CP B In (pin 4).
Note 31:
Clamp signal input threshold 2
∑ Test condition 4 (CP mode)
∑ Input : no signal
Change to DC the CP that is applied to CP A In (pin 3), gradually raise its voltage from 2.5V, and
measure the voltage at CP A In (pin 3) when the voltage of channel A G input pin (pin 3) is clamped
at 0.9±0.1V. Change SW
2B
from a to b, and make similar measurements for CP B In (pin 4), at
channel B G input pin (pin 40).
Note 32:
Input-switching signal threshold
∑ Test condition 2 (direct coupling mode)
∑ Input : no signal
Adjust VR34 and VR40 so that the voltage of pin 34 is 0.9V and that of pin 40 at 1.6V. Change SW
2A
from a to b, gradually raise from 0V the DC voltage at A / B Select (pin 2), and measure the pin 2
voltage when the output signal of G output pin 19 changes from the white level to the black level.
(Voltage difference from the 0 level must be within 0.4V.)
Note 33:
Reversed polarity signal threshold
∑ Test condition 5 (CP mode, fixed polarity)
∑ Input : no signal
Change SW
7A
from a to b, gradually raise from 0V the DC voltage applied at Pol ln pin (7), and
measure the pin 7 voltage when the output voltage of G output pin 19 exceeds 6.5V (rapidly rising
from about 4V to about 9V).
Note 34:
Reversed polarity phase-switching signal threshold
∑ Test condition 5 (CP mode, fixed polarity)
∑ Input : no signal
Change SW
6A
from a to b, gradually raise from 0V the DC voltage applied at pin 6, and measure the
pin 6 voltage at the time the output voltage of G output pin 19 exceeds 6.5V (rapidly rising from
about 4V to about 9V).

TA1204AF
2001-02-07 19/25
ELECTRICAL CHARACTERISTICS
List of Setup Test Condition
PIN /
FUNC-
TION
1 2 3 4 6 7 8 11
23 24 25 26 27
SW /
VR
-R
Cont.
A / B
Select
CP A
In
CP B
In
V Inv. Pol In Comm
Cent.
Comm
AMP
V
0
Cent.
R
Cutoff
Com
Cutoff
B
Cutoff
Bright
-ness
SW
A
OFF
a b b a b
OFF
OFF
OFF
OFF
OFF
OFF
OFF
SW
B a a a a a
VR
SIG
PIN /
FUNC-
TION
28 29 30 32 33 34 36 38 40 42 43 44
SW /
VR
B
Drive
Com
Drive
R
Drive
B In1 Con-
tast
G In1 R In1 B In2 G In2 R In2
-B
Cont.
-Com
Cont.
SW
A
OFF a OFF a a ON a a ON a OFF
OFF
SW
B OFF OFF
OFF
OFF
OFF
OFF
Test
Condition
1
(no signal,
non-
operative)
VR
SIG
PIN /
FUNC-
TION
1 2 3 4 6 7 8 11
23 24 25 26 27
SW /
VR
-R
Cont.
A / B
Select
CP A
In
CP B
In
V Inv. Pol In Comm
Cent.
Comm
AMP
V
0
Cent.
R
Cutoff
Com
Cutoff
B
Cutoff
Bright
-ness
SW
A
OFF
a b b a b
OFF
OFF
OFF
OFF
OFF
OFF
OFF
SW
B a a a a a
VR
SIG
CP1 CP1 POL
PIN /
FUNC-
TION
28 29 30 32 33 34 36 38 40 42 43 44
SW
/VR
B
Drive
Com
Drive
R
Drive
B In1 Con-
tast
G In1 R In1 B In2 G In2 R In2
-B
Cont.
-Com
Cont
SW A
OFF
a
OFF
b a ON b
b ON b OFF
OFF
SW
B OFF ON OFF OFF ON
OFF
Test
Condition
2
(DC coupling,
typical
operation)
VR
SIG
(SIG)
(SIG)

TA1204AF
2001-02-07 20/25
PIN /
FUNC-
TION
1 2 3 4 6 7 8 11 23 24 25 26 27
SW /
VR
-R
Cont.
A / B
Select
CP A
In
CP B
In
V Inv. Pol In Comm
Cent.
Comm
AMP
V
0
Cent.
R
Cutoff
Com
Cutoff
B
Cutoff
Bright
-ness
SW
A
OFF
a b b a a OFF OFF OFF OFF OFF OFF OFF
SW
B a a a a a
VR
SIG
CP1 CP1
PIN /
FUNC-
TION
28 29 30 32 33 34 36 38 40 42 43 44
SW /
VR
B
Drive
Com
Drive
R
Drive
B In1 Con-
tast
G In1 R In1 B In2 G In2 R In2
-B
Cont.
-Com
Cont.
SW A
OFF
a
OFF
b a ON b
b ON b OFF
OFF
SW
B OFF ON OFF OFF ON OFF
Test
Condition
3
(DC
coupling, fixed
polarity)
VR
SIG
(SIG)
(SIG)
PIN /
FUNC-
TION
1 2 3 4 6 7 8 11 23 24 25 26 27
SW /
VR
-R
Cont.
A / B
Select
CP A
In
CP B
In
V Inv. Pol In Comm
Cent.
Comm
AMP
V
0
Cent.
R
Cutoff
Com
Cutoff
B
Cutoff
Bright
-ness
SW
A
OFF
a b b a b
OFF
OFF
OFF
OFF
OFF
OFF
OFF
SW
B a a a a a
VR
SIG
CP2 CP2 POL
PIN /
FUNC-
TION
28 29 30 32 33 34 36 38 40 42 43 44
SW /VR
B
Drive
Com
Drive
R
Drive
B In1 Con-
tast
G In1 R In1 B In2 G In2 R In2
-B
Cont.
-Com
Cont.
SW
A
OFF a OFF a a ON a a ON a OFF
OFF
SW
B OFF OFF
OFF
OFF
OFF
OFF
Test Condition
4
(clamp, typical
operation)
VR
SIG
(SIG) (SIG)
(SIG)
(SIG)
(SIG)
(SIG)

TA1204AF
2001-02-07 21/25
PIN /
FUNC-
TION
1 2 3 4 6 7 8 11 23 24 25 26 27
SW /
VR
-R
Cont.
A / B
Select
CP A
In
CP B
In
V Inv. Pol In Comm
Cent.
Comm
AMP
V
0
Cent.
R
Cutoff
Com
Cutoff
B
Cutoff
Bright
-ness
SW A
OFF
a
b
b
a
a OFF OFF OFF OFF OFF OFF OFF
SW
B
a
a
a
a
a
VR
SIG
CP2 CP2
PIN /
FUNC-
TION
28 29 30 32 33 34 36 38 40 42 43 44
SW /
VR
B
Drive
Com
Drive
R
Drive
B In1
Con
-tast
G In1 R In1 B In2 G In2 R In2
-B
Cont.
-Com
Cont.
SW
A
OFF a OFF a tast ON a a ON a OFF
OFF
SW
B
OFF
OFF
OFF
OFF
OFF
OFF
Test
Condition
5
(clamp,
fixed
polarity)
VR
SIG
(SIG)
(SIG)
(SIG)
(SIG)
(SIG)
(SIG)
PIN /
FUNC-
TION
1 2 3 4 6 7 8 11 23 24 25 26 27
SW /
VR
-R
Cont.
A / B
Select
CP A
In
CP B
In
V Inv. Pol In Comm
Cent.
Comm
AMP
V
0
Cent.
R
Cutoff
Com
Cutoff
B
Cutoff
Bright
-ness
SW A
OFF
a
b
b
a
a OFF OFF OFF OFF OFF OFF OFF
SW
B
a
a
a
a
a
VR
SIG
DC DC
PIN /
FUNC-
TION
28 29 30 32 33 34 36 38 40 42 43 44
SW /VR
B
Drive
Com
Drive
R
Drive
B In1 Con-
tast
G In1 R In1 B In2 G In2 R In2
-B
Cont.
-Com
Cont.
SW
A
OFF a OFF b a ON b
b ON b OFF
OFF
SW B
OFF
ON OFF OFF ON
OFF
Test
Condition
6
(VTHcp)
VR
SIG
(SIG)
(SIG)
(SIG)
(SIG)
(SIG)
(SIG)
Note 1: This setup is based on the initial setup condition before starting various measurements.
Note 2: Symbols a, b, ON, and OFF show the SW setup.
Note 3: The underlined setup shows that it is to be changed when the setup of test condition 1 is specified as default.
Note 4: The signal names in the SIG column (CP1, CP2, POL ∑∑∑ ) show that the specified signals are applied on a
fixed basis. (SIG) applies signals to any one pin according to items.

TA1204AF
2001-02-07 22/25
CONTROL SIGNAL AND TEST SIGNAL

TA1204AF
2001-02-07 23/25
TEST CIRCUIT

TA1204AF
2001-02-07 24/25

TA1204AF
2001-02-07 25/25
PACKAGE DIMENSIONS
Weight: 1.15g (Typ.)